Auction Monitoring
Helping strategic sourcers monitor and visualize bids in fast-paced auctions
The problem
An auction is a sourcing event but much more fast paced. Where sourcing events run over the course of days to weeks, auctions compress all of that in 30-60 minutes. Suppliers bid live against each other, prices move and rankings change. A strategic sourcer is glued to their screen to monitor outliers, track responses and ensure healthy competition.
The existing product made it incredibly hard to do all this. Users were spending their time navigating the UI instead of doing analytical, strategic work.
Monitoring is a core experience but auction monitoring was forked off into its own experience, completely undiscoverable. And even once in that experience, it was hard to know where to go because pages that were different canonically had nearly identical content but with differing visualizations. The information architecture was a mess.
The solution
Auctions are a type of sourcing event so monitoring them needed to feel similar to monitoring other events, not something brand new with a learning curve like the older experience.
To keep things predictable for users, I fit auctions into the existing event monitoring experience, (which I had also designed). But what needed to change was the content: auction-specific charts like bid history and latest bids and information that guided the user to their goals.
Monitor overall auction
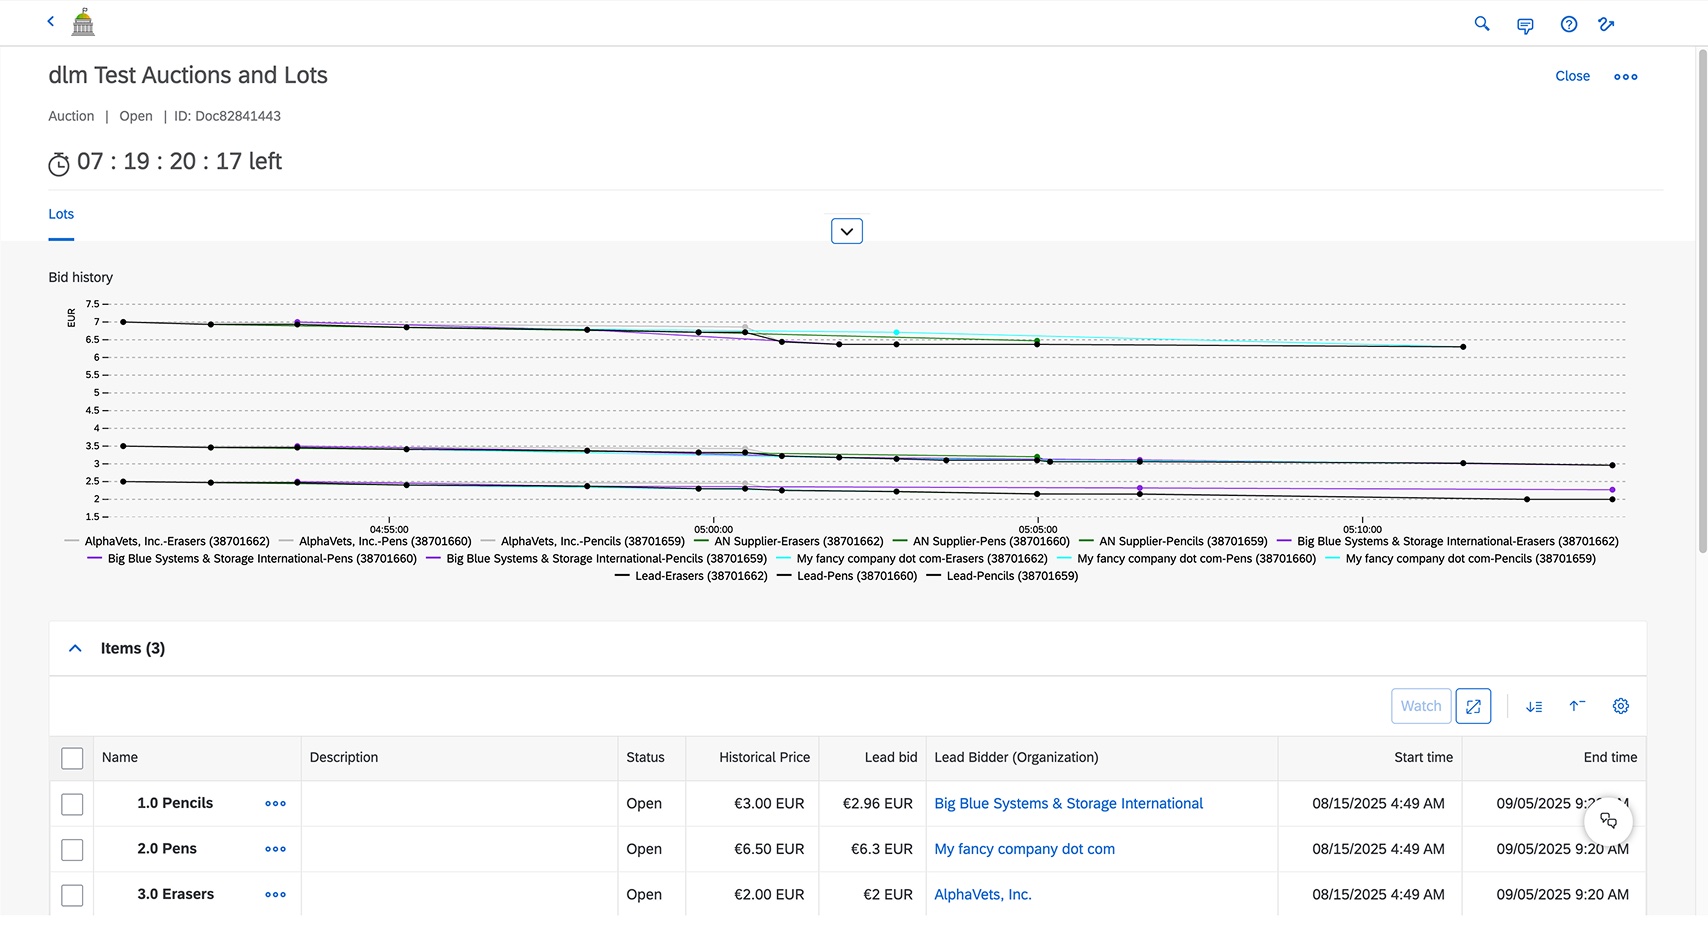
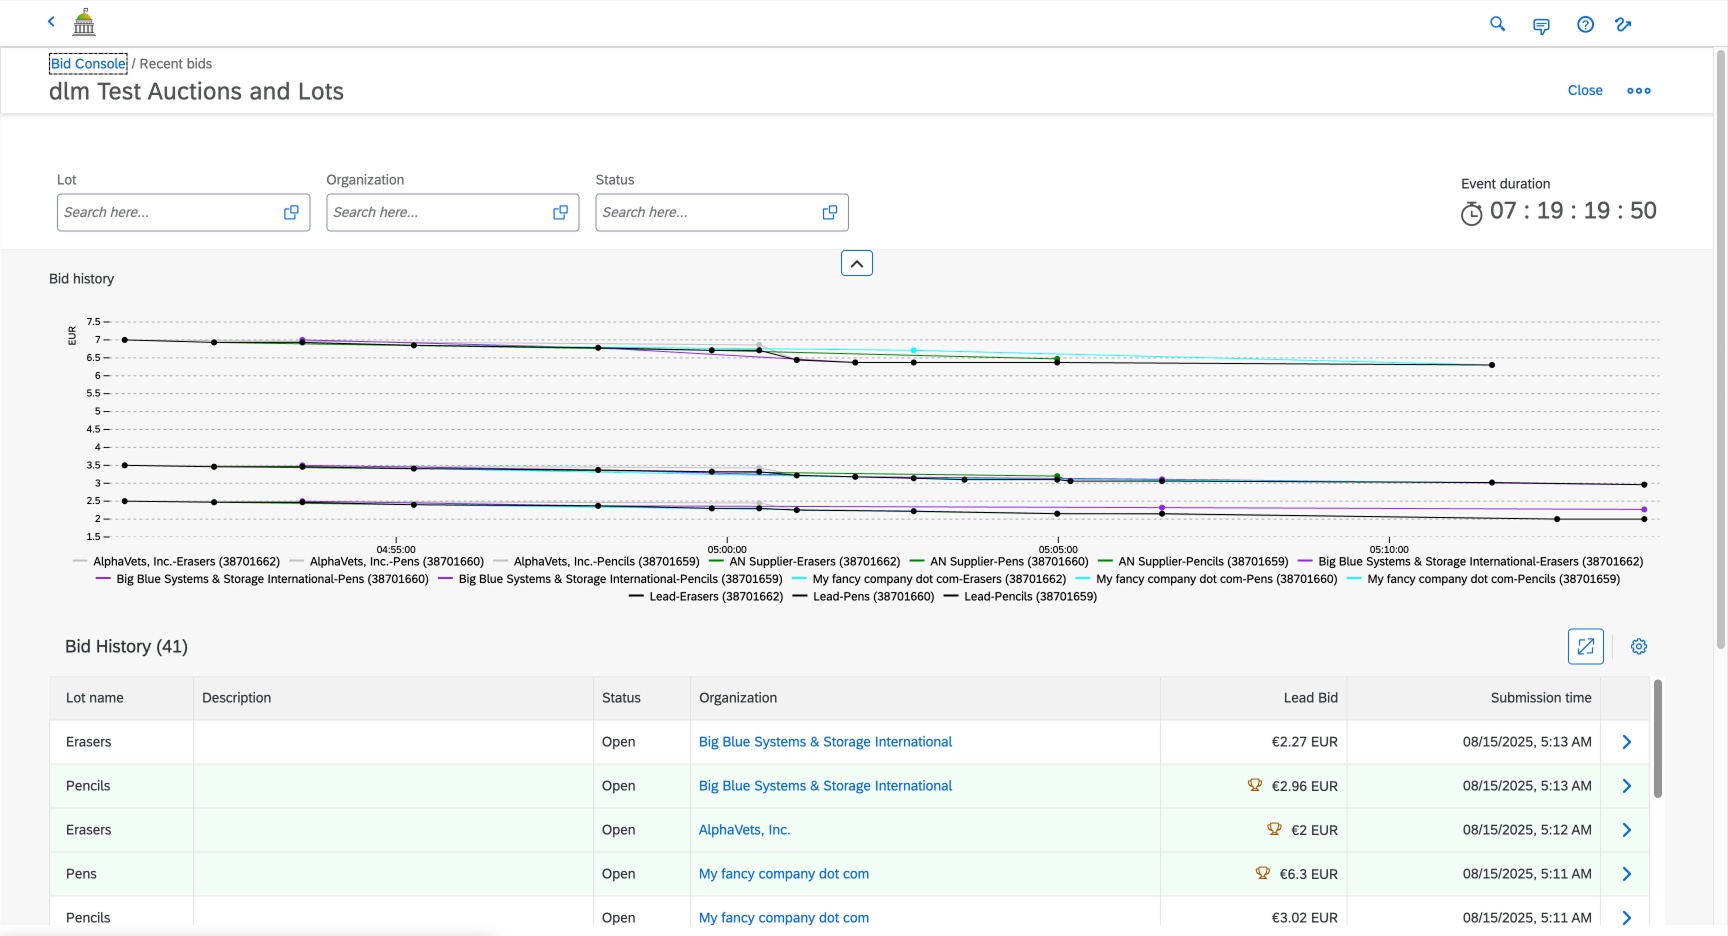
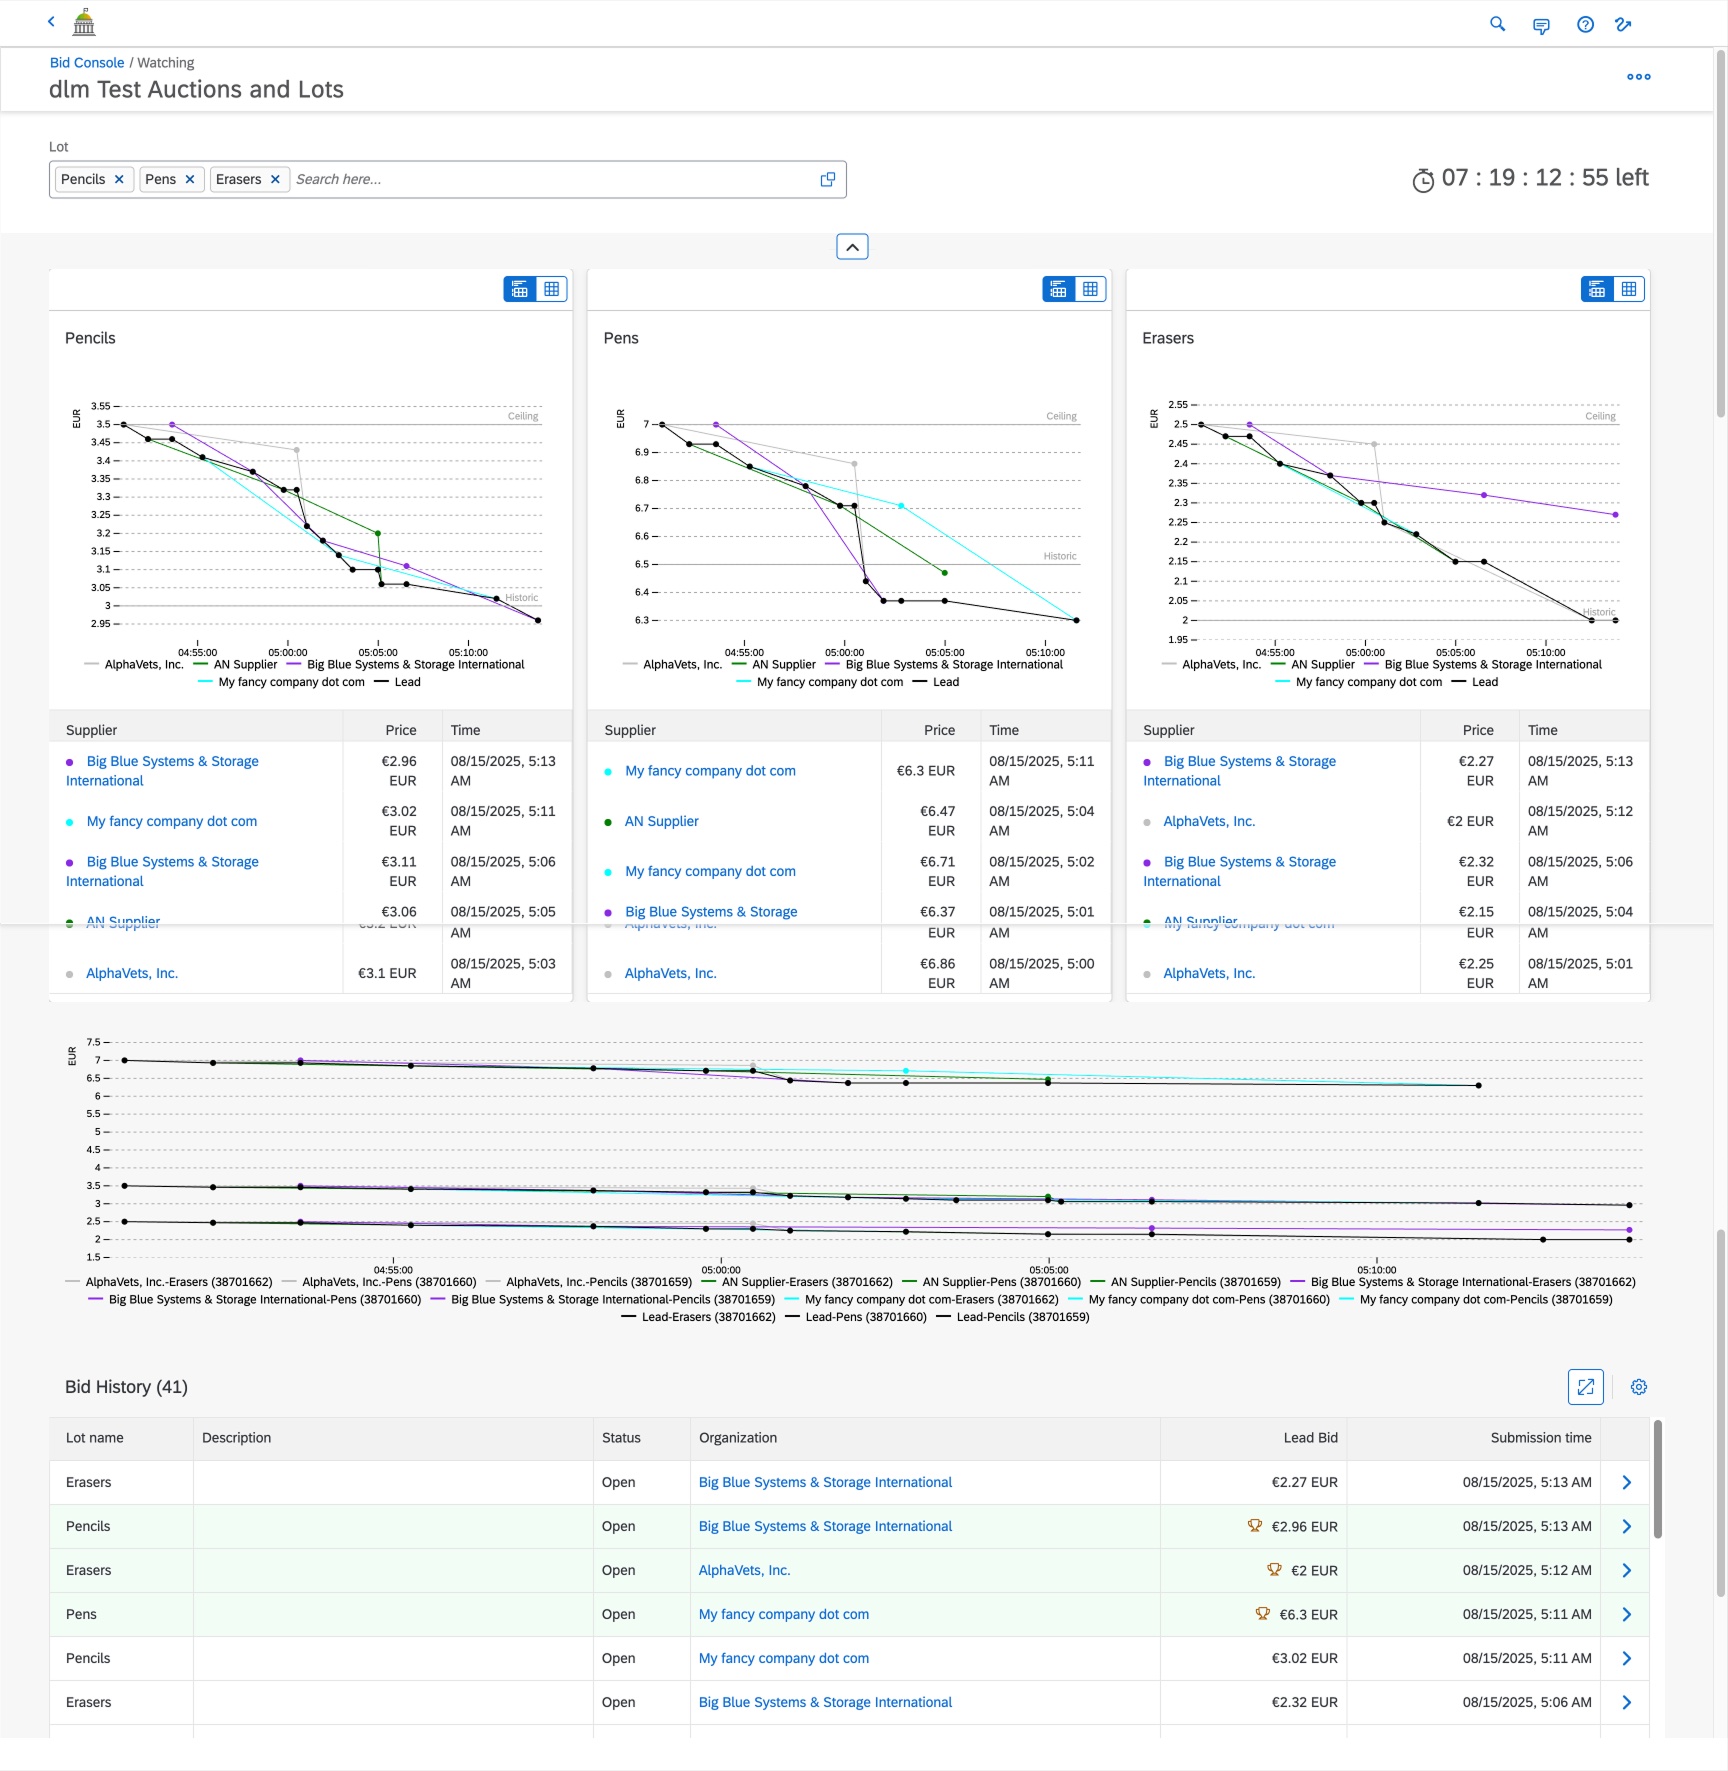
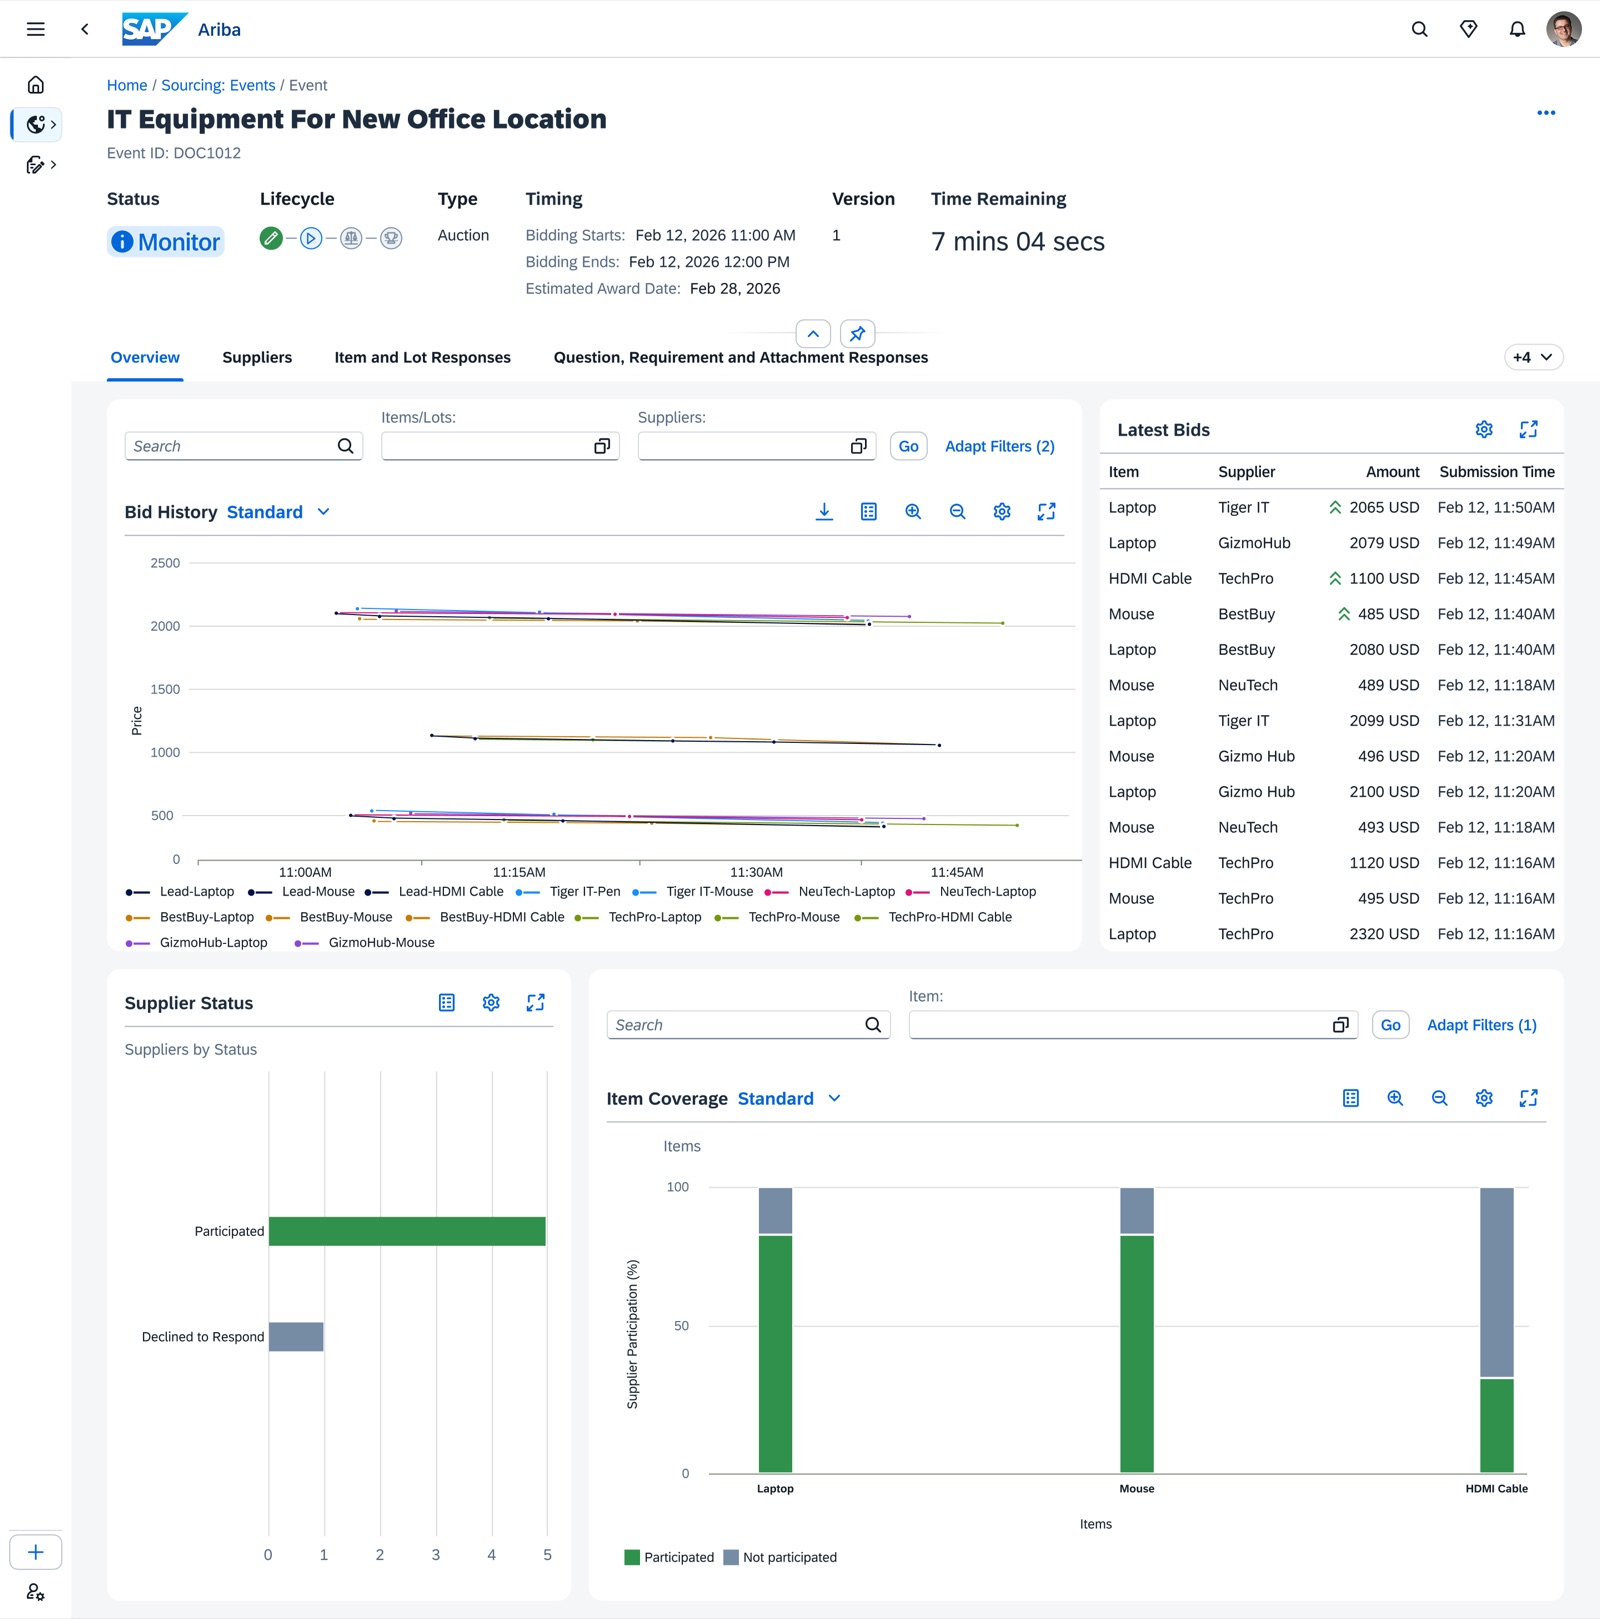
Users are glued to their screen for those 30-60 minutes, so it was important to provide a birds eye view into the overall auction health:
Bid History chart plotted all items and suppliers to monitor the shape of each item and spot outliers early.
Latest Bids streamed the bids as they came in to track how the lead bidder changed or spot unfair practices like collusion.
Monitor per item
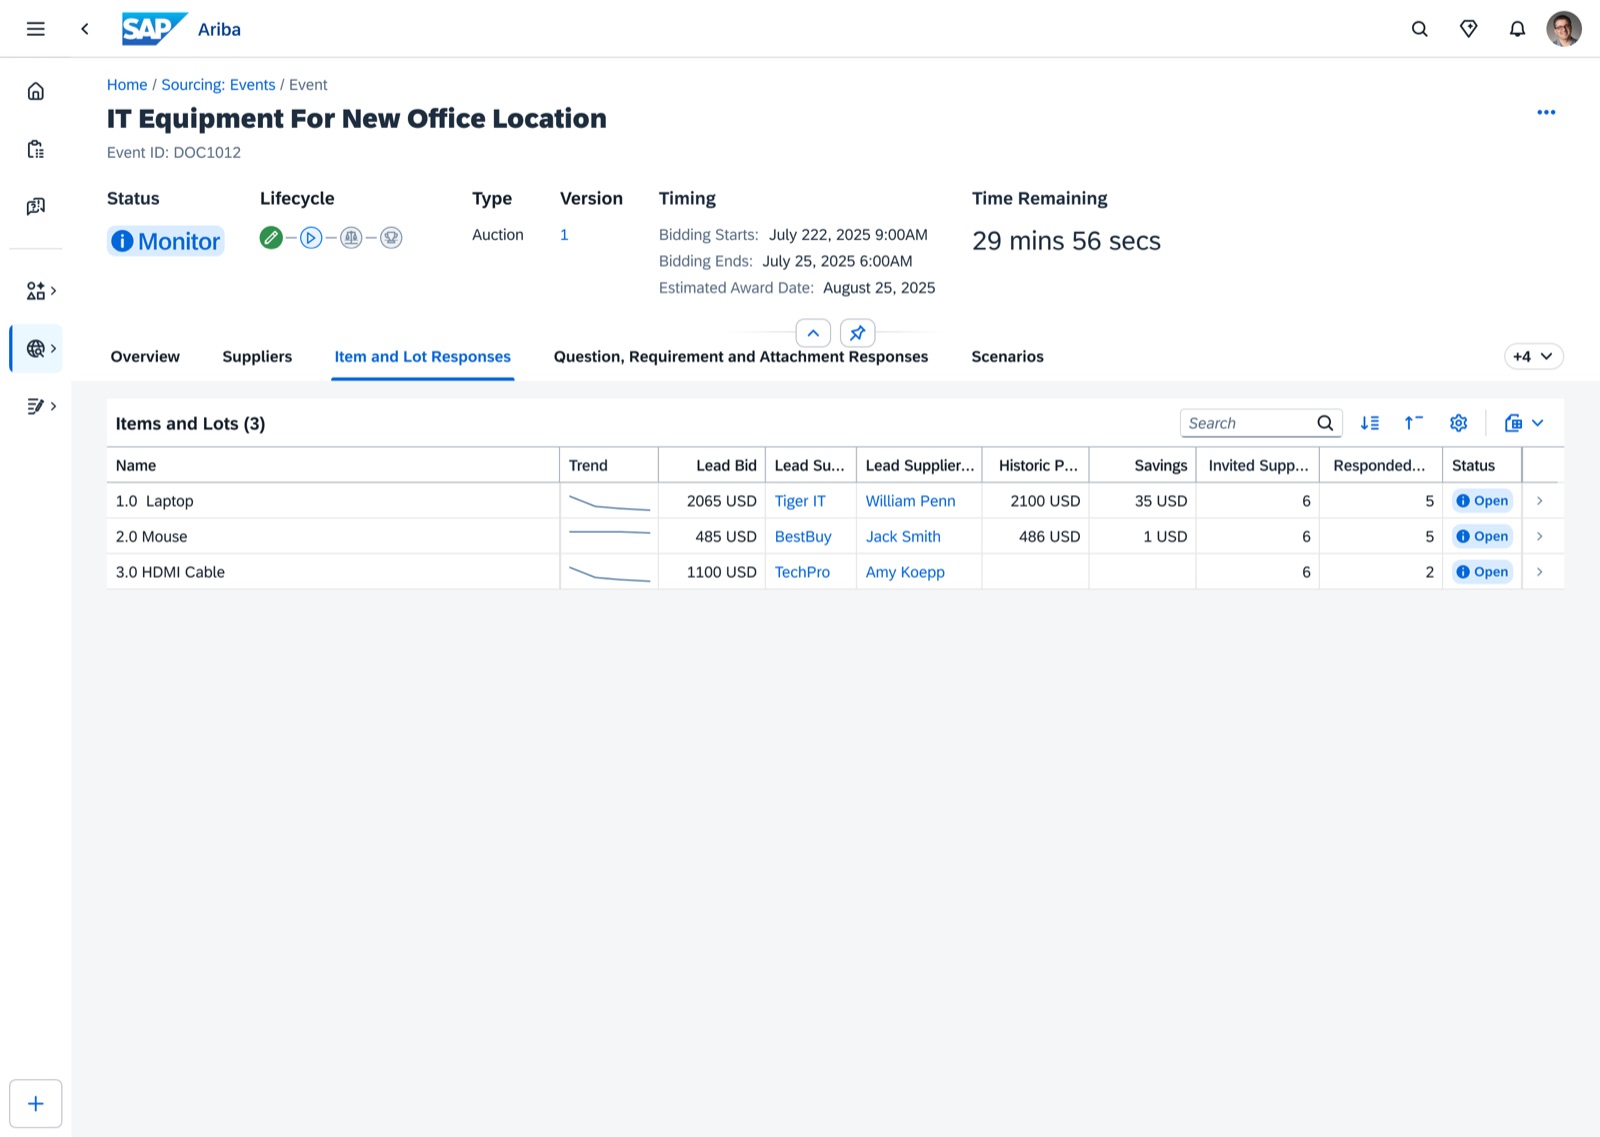
Adapting the items table by adding information that matters during an auction: trend, lead bid, lead supplier, historic price,
savings and status, to scan the health of each item in one pass.
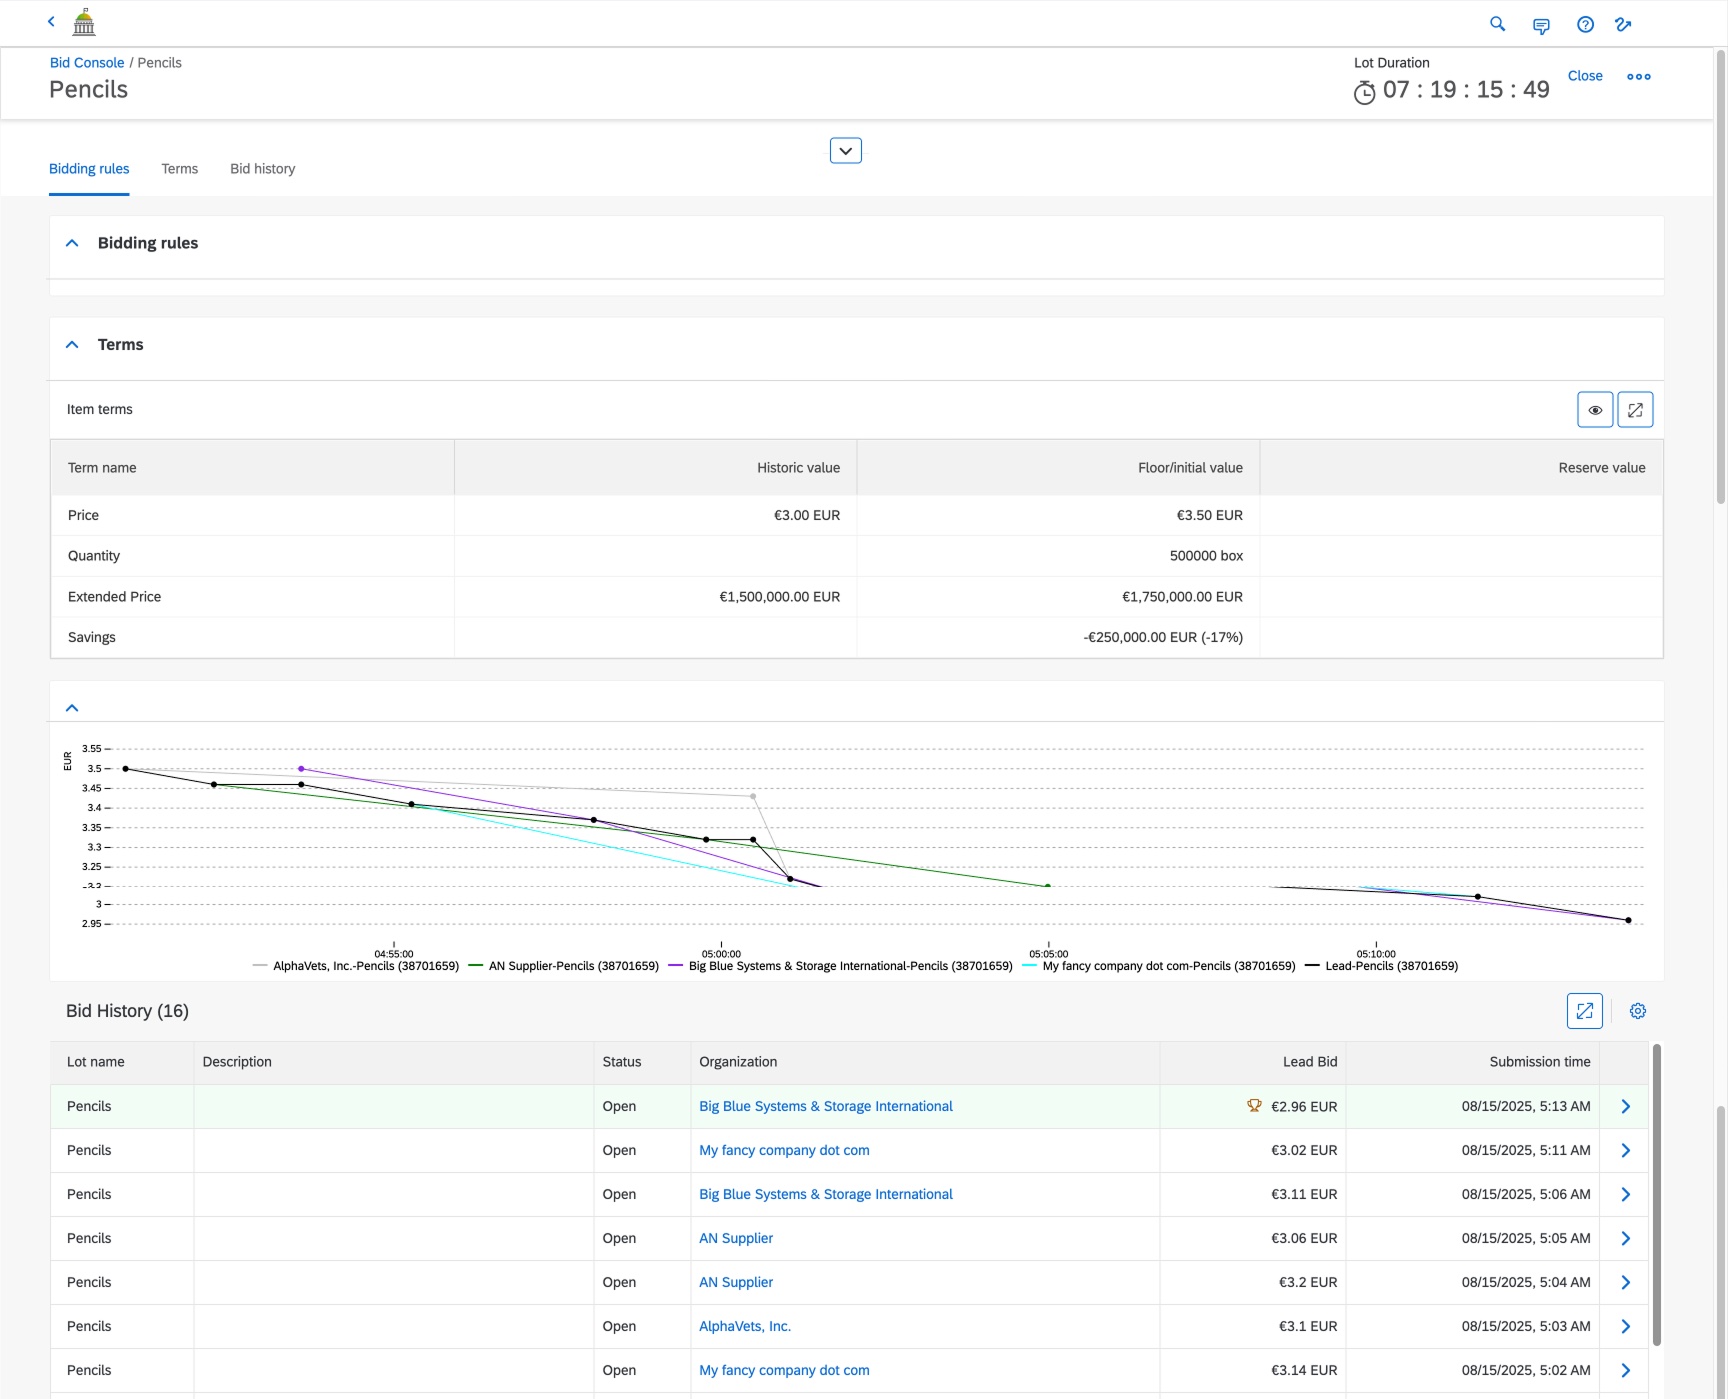
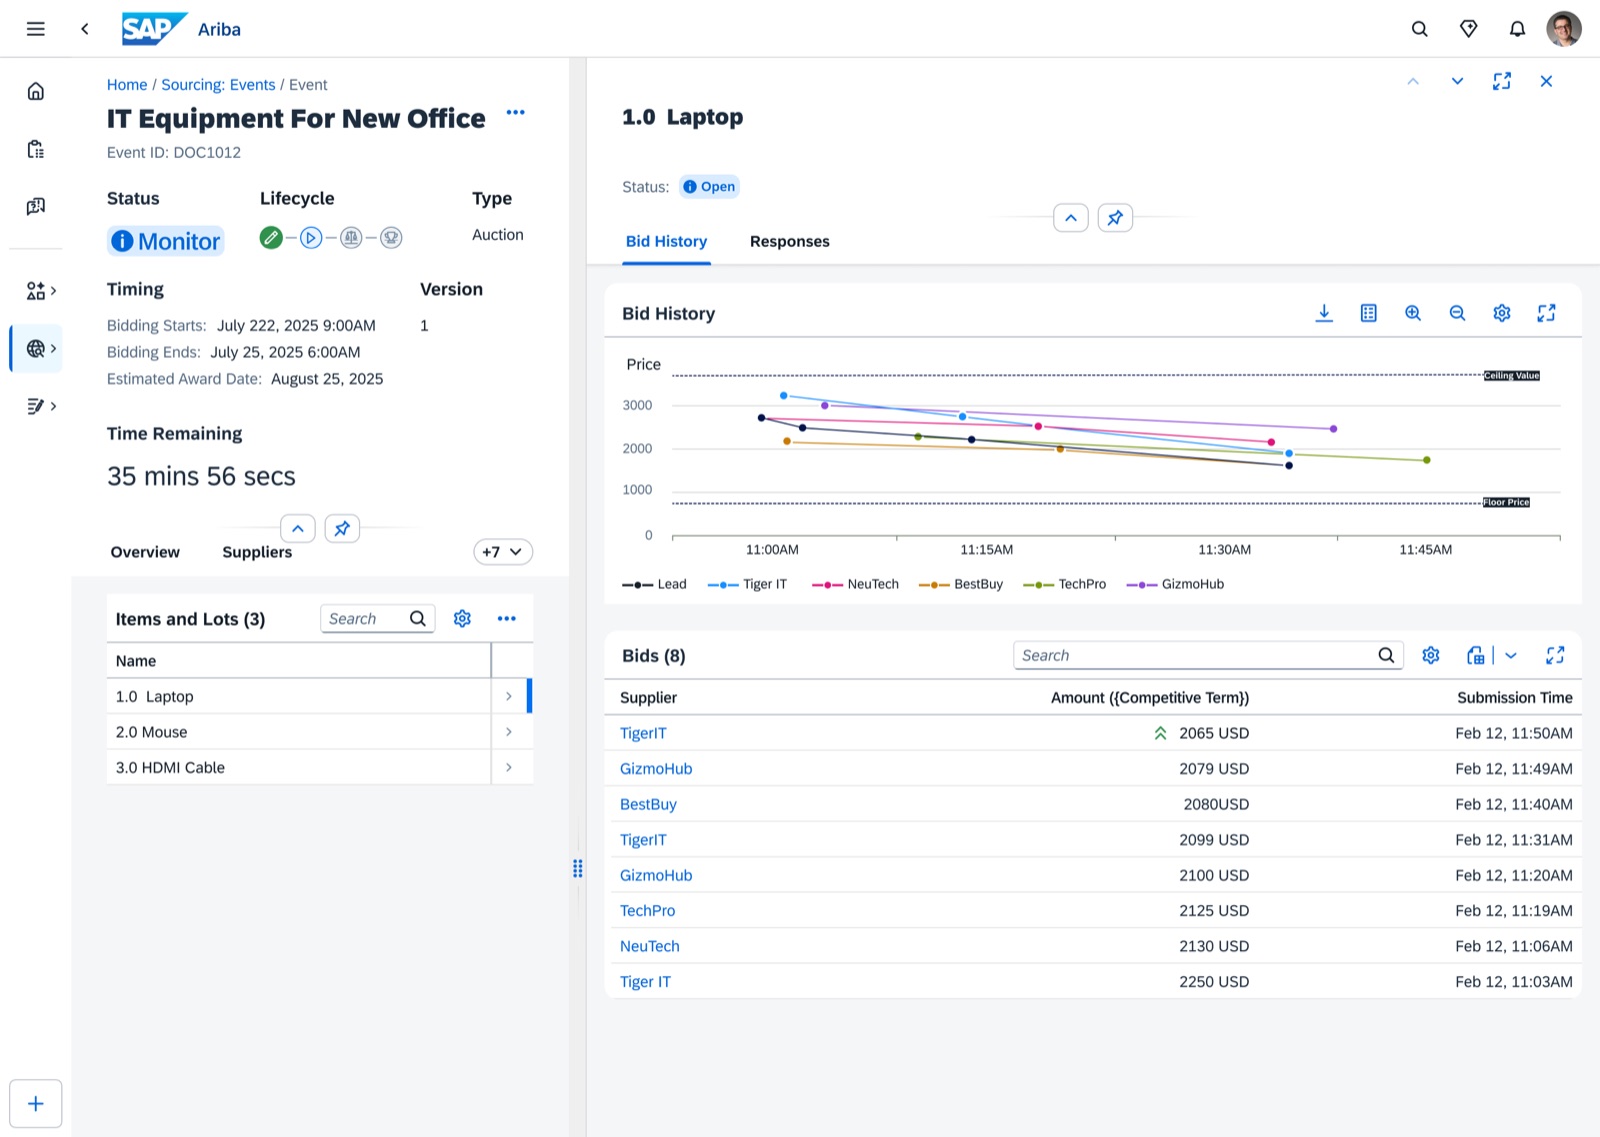
Drilling into an item opens the bid history
chart by default. The regular experience would show an information-dense table with bids, but during an auction where time is valuable, a chart says more.
My role
- Led the auction monitoring experience end to end, using the SAP Fiori design system.
- Made the scope and tradeoff calls together with PM and engineering, advocating for parts that were non-negotiable for users.
- Certain ideas were not implementable because they did not exist in the design system, so I worked with design system team to get feature requirements prioritized.
- Did E2E design QA before the feature was delivered and worked very closely with engineers.